ANTI-SUBMARINE INDICATOR LOOP DEFENCES IN THE UNITED STATES
Reading a Loop Signature
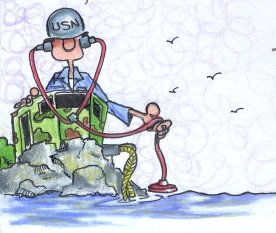
Drawing by Gerry Butler
Indicator Loops are long lengths of cable laid on the seafloor of harbors in WWII to detect enemy submarines. When a submarine or other steel ship passes overhead, an electrical signal is generated and this is detected and recorded at a nearby shore station (the "loop control hut", or "loop receiving station").
A paper chart is used to record the "signature" of the ship. In the United States, many of these paper charts have been archived at the National Archives and Records Administration (NARA) Northeast Region (Boston) branch, located at 380 Trapelo Road in Waltham, Massachusetts, USA. This is where the recordings below came from (my thanks to Martin Dwyer and Dave Pierson). This webpage is not so much about the details of how indicator loops were used in US harbors, but about how the loop signature can be read. More information about how they work can be found at Loop Works and further general details at Indicator Loops around the World. Specific examples of USN loop signatures and the ships that produced them can be seen at Pequot Loops in Action.
If you have any feedback please email me:
Dr Richard Walding
Research Fellow - School of Science
Griffith University
Brisbane, Australia
Email: waldingr49@yahoo.com.au
ANTI-SUBMARINE INDICATOR LOOPS
Indicator Loops were developed by the Royal Navy in the early 1900s and first trialled at the end of WW1. They were successfully deployed in WW2 in British ports and other Commonwealth countries such as Australia, Canada, New Zealand, South Africa, Kenya, the Mediterranean (Haifa, Alexandria, Malta), Ceylon, Penang, and in allied harbours (Iceland, Holland, Dardanelles). By 1942 the United States had adapted this technology for its own needs and a dozen United States Navy "loop receiving stations" were established along the eastern seaboard of mainland USA.
This diagram shows the arrangement of the cables in the loop ("3-legged") and the tail cable connecting them to the control station. This type was used throughout the USA. In the diagram above just two loops are depicted, but usually four to eight loops were used to defend a harbor.
Naming of the three "legs". A 3-legged loop is best thought of as two loops side-by-side with a distance of about 200 yards between legs. The centre wires are joined together in a junction box underwater at the end of the loop to make a "centre leg" or "middle leg". Thus, three wires go back to the shore station (outer leg, centre leg, inner leg). The outer leg is on the ocean side and the inner leg is on the shore side.


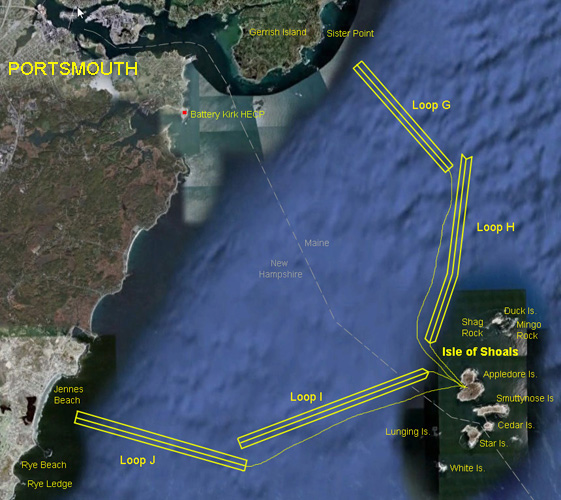
EXAMPLE OF A LOOP DEFENDED PORT - US EAST COAST 1942-45.
About a dozen US East Coast ports were defended with loops -
Boston, Portland, Portsmouth and Cape Cod to name just a few. One is shown below -
Portsmouth, Maine.
 |
|
An example of an Indicator Loop field. This one has four of the 3-legged loops and was used to defend Portsmouth Harbor, USA. The loops are typically about 2000 yards long and 400 yards wide. The loop control hut was on Appledore Island, Maine (to the bottom right). |
LOOP SIGNATURES
 |
 |
|
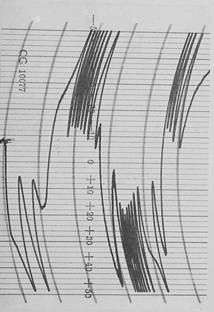
Sample of loop recorder paper from the NARA archives. The one on the left is from Casco Bay, Portland, Maine when USS Chicopee crossed the loop in May 1942. The one on the right was taken on 20th December 1943 at the Fort Williams Loop Receiving Station (also in Casco Bay, Portland) when USS New Jersey crossed the loop. They may look very different but are, in fact, quite similar when analysed. It has been rotated clockwise for analysis. The paper moves towards the left and a pen traces out a line representing the electrical voltage produced by the loops. |
|
EXAMPLE OF INDICATOR LOOP SIGNATURES FROM PORTLAND, MAINE, 1942
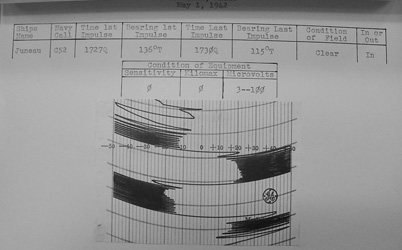
The chart recordings shown below are orientated the way they would appear to a navy watchkeeper. The chart paper is 4" wide (100 mm) and comes out of the recorder vertically and falls to the floor. When the signature is being analysed, the chart paper is turned sideways as shown above. My thanks to Martin Dwyer for locating and sending me these.
 |
 |
|
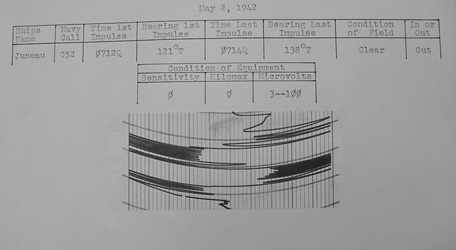
Portland Harbor - USS Juneau -
out. |
Portland Harbor - USS Juneau - in. |
 |
 |
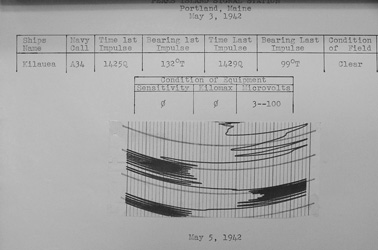
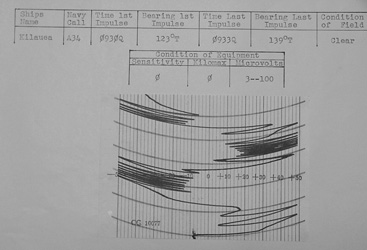
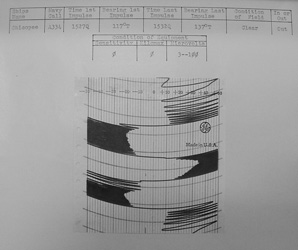
| Portland Harbor - USS Kilauea -
out. Kilauea was renamed Mount Baker 17 March 1943 and survived the war, finally being scrapped in 1974. |
Portland Harbor - USS Kilauea - out. |
 |
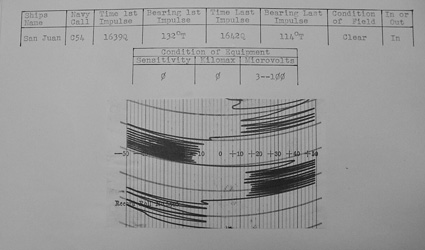 |
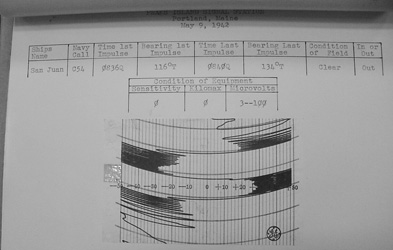
| Portland Harbor - USS San Juan -
out. Based in the Western Pacific for the war and San Juan received 13 battle stars for her service. |
Portland Harbor - USS San Juan - out. |
 |
 |
| Portland Harbor - USS Chicopee -
out. USS Chicopee (AO-34) was the lead ship of her class of oilers for the United States Navy during World War II. |
Portland Harbor - USS Chicopee - in. |
READING A SIGNATURE
The original loop signature of submarine USS-48 coming in to Portland Harbor on June 2nd, 1942 is shown on the left.
 |
|
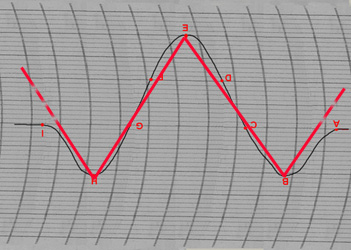
| Original signature. You need to think of it as peaks B&C registering the galvanometer swings (+ then -) over the outer loop; D&E (++) then F&G (- -) are the big swings over the middle leg; and H&I (+ -) the swings over the inner leg. | "Unfolded" signature of the chart to the left. Because the pen reached the edge of the paper it was made to return to zero and continue on. The actual peak height is determined by adding all of the zig-zags in one group together. For example the group of peaks C, D, E on the original signature to the left has to be added (50 + 50 +50 = 150 µV (microvolts)). |
Unfolding the signature. Consider the signature on the left:
- At "A" - the ship is just approaching the outer loop from the ocean side (that is, the ship is coming "in" to harbor) but not close enough to generate a signal. Thus the pen is at the "zero" (centre) position. As the bow of the ship begins to cross the outer loop, a positive voltage is generated and the pen begins to trace out a line towards the bottom (point "B"). While this is happening the paper moves leftwards underneath the pen.
- At "B" - the middle of the ship is directly over
the outer leg. Then the pen returns to zero because the pen has hit the side
of the paper.
- At "C" - the stern of the ship crosses the outer leg.
The +50µV generated by the bow crossing the loop is now cancelled by
the -50µV of the stern crossing the loop and the pen shoots back to
zero as it has hit the edge of the paper.
- At "D" - the ship has passed the outer leg and is now starting to cross the middle leg. The pen hits the edge and shoots back to zero then builds up again. Notice that after peak "C" there are two more peaks ("D" and "E") of -50 µV = -100 µV. The centre legs generate twice the voltage (and with opposite polarity) to the outer leg as the middle leg is actually made up of two wires side-by-side so the voltages add together.
- At "E" - the middle of the ship is over the
middle leg and the pen hits the edge so it shoots back to zero. This leg is
actually two wires in one and a voltage is being generated in each wire. By
virtue of the way the wires are connected, the voltages are the same polarity
but opposite to the outer legs so they add together to make a signal twice as
big as the first leg but in the opposite direction (about +17 microvolts).
- At "F" - the stern of ship is crossing the middle
leg so a positive voltage is being produced. The pen shoots back to zero and
builds up again towards a peak at "G".
- At "G" - the stern of the ship finishes crossing
the middle leg, so more positive voltage is being produced (total of +100
µV). This has now cancelled out the -100
µV generated as the bow crossed the middle leg.
- At "H" - the ship begins to cross the inner loop.
The voltage is the same as when it crossed the outer loop (+50
µV).
- At "I" - the stern of the ship crosses the inner loop and the voltage produced (-50 µV) cancels the voltage produced by the bow and the pen is now back to zero.
|
|
|
Note how much this (simple) loop signature of USS New Jersey crossing the Portland loop looks like the unfolded signature at the top of this section. When the sensitivity is high or the magnetism of the ship is strong the pen zig-zags to produce a far more complicated signature. |
THE INVERTED "WILLIAM" PATTERN
The shape of the signature above is like an up-side down "W". It is called an "Inverted William" pattern by navy analysts (where William was the Military Phonetic Alphabet code for the letter "W" during WWII, or to be precise from 1913 to 1957, and then Whiskey became the standard). If you invert the "Inverted William" pattern you can clearly see the "W" shape (below):
 |
|
The "Inverted William" pattern, when inverted, produces the characteristic shape of the letter "W". |
PERTUBATIONS: INDUSTRIALS AND TERRESTRIALS
Many artifacts are introduced into a loop signature by events that give rise to electrical signals in the loops but are not due to the presence of ships. These artifacts (spurious signals or 'false positives') are called 'perturbations', or 'perts', (unaccounted agitations or motions) are of three main types: Terrestrials, Industrials and Swings.
1. Terrestrials come "from the Earth". Changes in the Earth's magnetic
field are natural and occur daily (called diurnal changes) but by a
clever arrangement of the loops these are generally neutralised. It was in 1916
that Scottish Physics Professor Dr Alexander Crichton Mitchell realised that by
twisting a loop in half and making a figure-of-eight loop these terrestrials
could be cancelled out. What in effect he did was make one half of the loop
reversed so any changes through that half were cancelled out by similar changes
in the other half. This is the basis of the 3-legged loop. However, when a bolt
of lightning strikes the water over a loop, the two halves may not cancel out.
This is particularly obvious during magnetic storms, aurorae (Northern Lights)
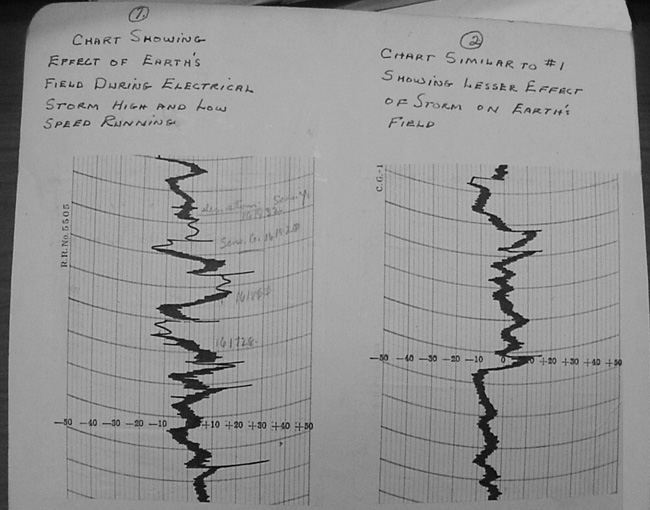
and electrical storms. The following diagram shows the effect of "terrestrials"
on the Peak's Island loop in Casco Bay at Portland USA.
 |
|
The effect of an electrical storm on the Peak's Island loops at Portland, USA. These irregular pertubations of the chart recorder pen are spurious and unwanted signals that confuse the loop watchkeepers as they can disguise the presence of an enemy submarine. Because they are due to the Earth's natural behaviour, they are called "Terrestrials". |
2. Industrials - are a second type of pertubation. They are caused by machinery in close proximity to the loop. Examples are electric trams and trains, motors and other devices that emit unwanted electrical or magnetic disturbances. Even a mile away, industrials can cause pertubations. When the Kew (London) magnetical observatory began to experience too much industrial noise, a new magnetical observatory was built in 1908 at Eskdalemuir - in the remote Scottish moors, as far away from any industrial noise as possible. This has often happened with magnetical observatories the world over - they are built in an area of low industrial noise and then the region develops so the observatory has to be shifted. This happened at Madras, India (shifted to the mountain tops of Kodiakanal); in Bombay (India) - shifted from Colaba on the southern outskirts to the coastal town of Alibag.
3. Swings - are when the loop cable swings in the ocean current and generates a false signal. A loop signal is generated when there is relative motion between a loop cable and a magnetic field. The principal aim of a harbor defense loop is to detect the changing magnetic filed as an object (a ship) moves over the loop. In contrast, a false signal can be generated when the magnetic field remains stationary (that is the normal Earth magnetic field) and the loop cable swings in it by the force of the ocean current. This is why the cables are loaded with the heavy metal lead (Pb) so that they follow the contours of the seafloor and can not swing. It is difficult to ensure the cables do sit on the seafloor as sometimes they hang between two nearby ridges. Sailors on the loop laying ships, such as the USCG Pequot, take particular care to lay the loop cable slowly with plenty of slack so it can sit on the seafloor. But in wartime, not all goes to plan. But also, sometimes the ocean current is so strong in narrow channels that the loop cables is pushed back and forth along the seafloor. This chaffing will wear away the protective steel armour and cause the cable to short circuit (or develop a "sea cell" as they say).
PHYSICIST HELPS READ US AND AUSTRALIAN LOOP SIGNATURES
In 1942, Japanese military attacks in the South West Pacific on the US, Australia, New Zealand and Britain called for swift action in defending allied ports and harbors. Loops were installed at numerous bases such as Sydney, Brisbane, Newcastle, Darwin, Fremantle, Wellington, Auckland, Christchurch, Singapore, Hong Kong, Penang and Trincomalee. But as can be seen from the charts and descriptions above, it is not easy to read a chart and decipher a submarine's signature from the perturbations. Experts, often physicists, were called in to assist the navy when a suspected loop crossing occurred. In one famous case, three Japanese midget submarines entered Sydney Harbour on the night of May 31st, 1942 and the next morning. Loop signatures were obtained but it was unclear if they were submarine signatures or those of patrol boats or ferries. The Japanese submarines were all destroyed either by allied patrol boats or by the Japanese submariners themselves. Nevertheless, an expert was called in to help with reading the signatures. He was Dr Lynn H. Rumbaugh of Minnesota USA, on loan to the Allied Naval Forces in the Southwest Pacific. He came to Sydney in mid-June 1942 to confer with Australian, British and US Navy representatives. Even he had to agonise over the recordings for several days to come up with a tentative answer. Rumbaugh has neve been brought to prominence for his work with indicator loops in the South West Pacific and certainly deserves a tribute. As a physicist and an Australian who benefited from his work, I'd like to pay tribute to him now (below).|
Dr Lynn H. Rumbaugh |
Dr Lynn H. Rumbaugh was born in Ira, Iowa, 60 years ago. He graduated from Miami University in Oxford, Ohio, in 1928, and continued his studies at the California Institute of Technology, where he received his PhD in physics in 1932. He then went to the Bartol Research Foundation, first as a National Research Council fellow and later as a Bartol research fellow. From 1937 until 1946, Dr. Rumbaugh was associated with the Department of Physics at the University of Minnesota progressing from assistant professor to professor. In 1940 he became involved in defense work at the Naval Ordnance Laboratory, where he headed the Measurements Section and served as principal physicist in NOL's Mine Countermeasures Unit. In 1941-42, he was in charge of the Navy's Underwater Defense Group in Pearl Harbor, and for a time was assigned to the Allied Naval Forces in the Southwest Pacific as a scientific adviser for harbor defenses and undersea warfare.
The underwater defense of the Australian coastline, at the time the Japanese were threatening an invasion of that continent, then became the mission of Dr Rumbaugh. In carrying out this task, Dr. Rumbaugh worked with the U. S. Naval Attache, the Commander Allied Naval Forces Southwest Pacific, the Royal Australian Navy, and the Council of Scientific and Industrial Research. Dr. Rumbaugh left for Pearl Harbor from Washington soon after December 7, 1941. There he was in charge of 32 engineers from Naval Ordnance Laboratory and various Bureau of Ordnance activities working on under- water ordnance and countermeasures, harbor defenses, and degaussing under the leadership of Captain T. S. Boyd. Dr. Rumbaugh was in Noumea during the crucial Battle of the Coral Sea, and for the next six months he was on a full seven-day-a-week schedule in the south- west and south Pacific areas. Returning to Washington in the fall of 1942, Dr. Rumbaugh became head of the research unit of the Naval Ordnance Laboratory. At that time its principal work dealt with various phases of mine research and certain underwater ordnance problems naval degaussing activities.
It was while in this post that he was called in to review the loop signatures of the three Japanese midget submarines that entered Sydney Harbour, Australia on 31st May 1942. In 1943 Dr Rumbaugh's division was also associated in research with the Bureau of Ships and Bureau of Aeronautics, as well as with the Naval Petroleum Reserve and various He headed NOL's Research and Torpedo Engineering Division from 1942 to 1945, led the Research Department from 1945 to 1950, and in the period 1948-50 served as deputy technical director of the Laboratory. He died on 11th March 1964.
Reference: Physics Today 17(7), 81 (1964). California Institute of Technology, CIT News, April 1945, p 17.
Other pages: